Pupil Diameter and Variable Multifocal Contact Lens Zone Sizes Relate to Success
Finding the secret to a successful multifocal contact lens patient can be tricky. This is because there are multiple factors that contribute to a successful multifocal contact lens fitting. We will discuss these various factors throughout this blog series, but for now, let's turn our focus to pupil size as it relates to the multifocal optic zone sizes.
The SpecialEyes 54 Multifocal contact lens design offers custom center and peripheral zone diameters. This gives the practitioner the ability to control the area of multifocal optics and how they are distributed over the patient’s pupil. This is particularly helpful for patients with large or small pupils, or when no over refraction improves vision. With the implementation of our pupil size fitting methodology via the SpecialEyes Multifocal Simulator, the success of the 54 Multifocal contact lens began to rise.
To further examine this concept, SpecialEyes asked a statistician to analyze pupil size in relation to near-center and peripheral optic zone diameters as a predictor of positive patient outcomes when finalizing a custom soft multifocal contact lens prescription. The data included was comprised of 48 successful and 39 unsuccessful custom soft multifocal contact lens patients, with a total of 91 eyes in the successful group and 70 eyes in the unsuccessful group. The near-center and peripheral zone diameter values of the SpecialEyes 54 Multifocal contact lenses were designed from a pupil-size fitting methodology, where zone sizes were determined by pupil size. Click here to read the full study.
The analysis began by examining the likelihood of patient success as a result of the measured variables (pupil size, radius, lens diameter, power, cylinder, axis, and add power). The variables tested in this study did not reveal exactly why some patients were successful and others were not. However, when controlling for all variables, results indicated the choice of peripheral zone diameter size to be a modest predictor of success—significantly for OD (p=.01) and marginally for OS (p=.067). In the SpecialEyes 54 Multifocal near-center lens design, the peripheral zone diameter is the point in the lens at which it reaches full distance power. If you are unfamiliar with the 54 Multifocal contact lens design, check out our multifocal products page for more detailed information.
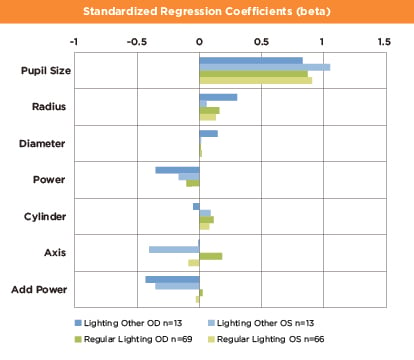
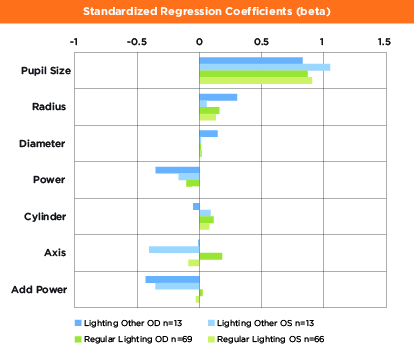
This graph depicts factors associated with the size of the near-center zone diameter (average R2=.79). In regular lighting, pupil size was the primary factor impacting the size of the near-center zone. When the lighting conditions were altered, add power also affected the size of the near-center zone.
Further investigation unveiled the association between the measured variables and the assigned near-center and peripheral zone diameter sizes. The graphs in Figures 4 and 5 demonstrate that pupil size had a clinically relevant and statistically significant impact on both near-center and peripheral zone diameter sizes.

This graph depicts factors associated with the size of the peripheral zone diameter (average R2=.75). In regular lighting, pupil size was the primary factor impacting the size of the peripheral zone. When the lighting conditions were altered, add power also affected the size of the peripheral zone.
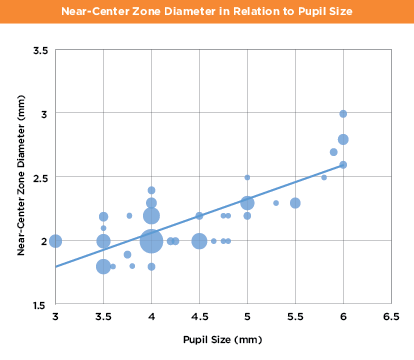
This graph predicts near-center zone diameter in relation to pupil size.
Using a regression of near-center zone diameter on pupil size for all successful patients under ambient room illumination conditions, we then built a prediction model for the near-center zone diameter. (See Figure 6). The association was strong (R2 = .66).
The model was then further developed using pupil size and radius (which were the best predictors of success) to predict near-center zone sizes. The predicted near-center zone diameter value alone was sufficient to find the best-fitting peripheral zone diameter value.
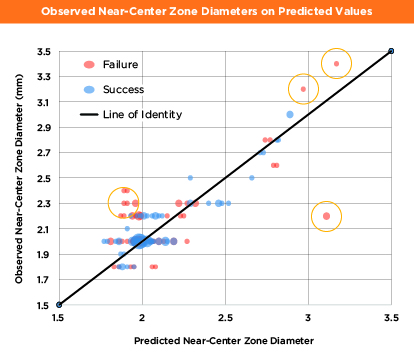
Figures 7 and 8 illustrate the relationship between the predicted model and the observed near-center zone and peripheral zone diameter values, and as you can see those not following the pupil size fitting methodology (average successful near-center and peripheral zone diameter selections) were more likely to fail (see yellow circles in Figures 7 and 8).
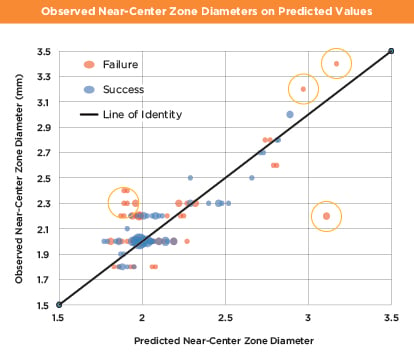
This graph illustrates the relationship between the predicted model and the observed near-center zone diameter values. It features a Jitter plot of all observed near-center zone diameters on predicted values. The Wilcoxon test of success on the absolute value of the residuals was significant at p = .002. Absolute residuals were tested because of the distribution of errors above and below the line of identity, which is drawn through the center of the graph. The Wilcoxon test used only samples not included in developing the model
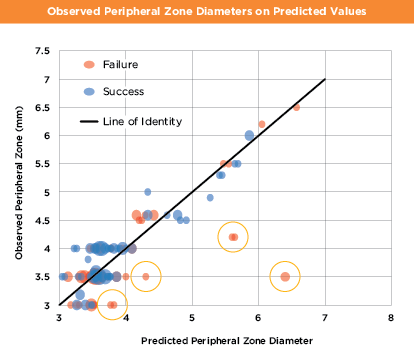
This graph illustrates the relationship between the predicted model and the observed peripheral zone diameter values. It features a Jitter plot of all observed peripheral zone diameters on predicted values. The Wilcoxon test of success on the non-absolute value of the residuals was significant at p = .046. Non-absolute residuals were used in the test because all the outlying residuals were below the line of identity, which is drawn through the center of the graph. The test used only samples not included in developing the model.
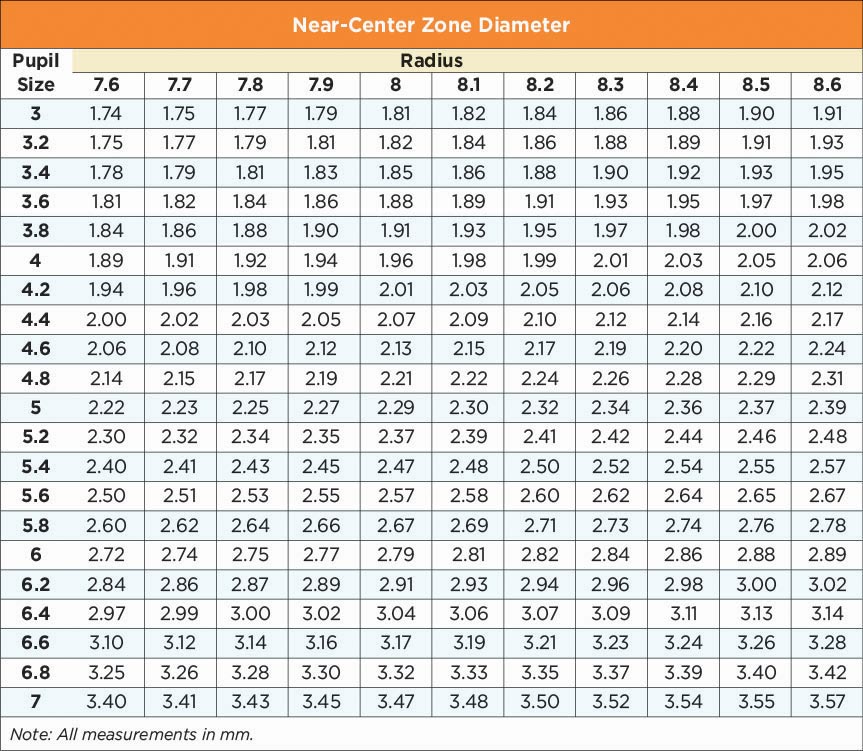
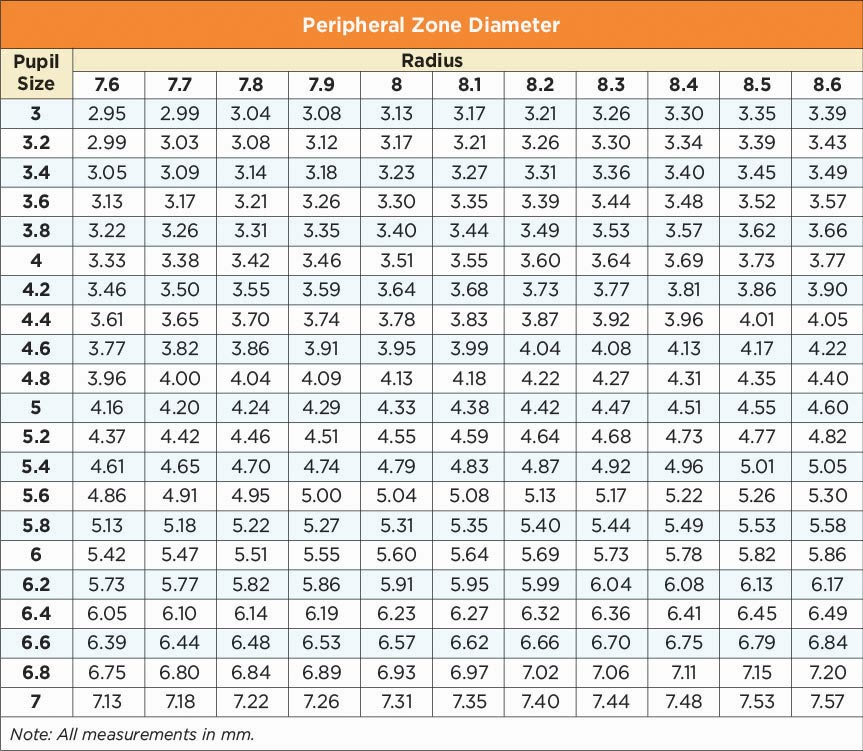
Taking what we learned about pupil size and radius, the model was further developed and tables were created to assist in determining the near center and peripheral zone diameters (Tables 1 and 2). The average successful diameter can be identified at the intersection of the row representing the patient’s pupil size and the column representing the radius. (Refer to Table 1 for near-center zone diameter and Table 2 for peripheral zone diameter.) For example, if the median pupil size is 4.2mm and the median radius is 8.1mm, the tables indicate the recommended near-center zone diameter would be 2.03mm and the peripheral zone diameter would be 3.68mm.
This table depicts near-center zone diameter. Line up the pupil size and radius to determine the suggested near-center zone diameter.
This table depicts peripheral zone diameter. The peripheral zone diameter uses the near-zone prediction and requires no additional measurements.
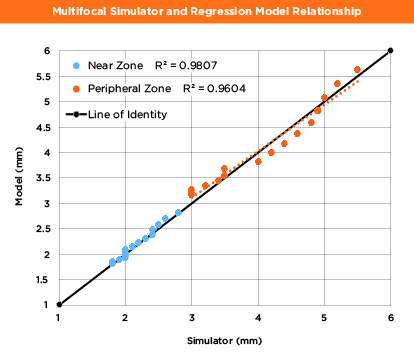
We then used the predicted near center and peripheral zone diameters values from the 8.1mm radius column to test the association with values generated by the SpecialEyes Multifocal Simulator. There is a strong correlation (see Figure 9) between the values generated by the SpecialEyes Multifocal Simulator and the model’s predicted near-center and peripheral zone diameter values from the data set, thus validating the simulator’s pupil-size fitting methodology.
This graph illustrates the relationship between the SpecialEyes Multifocal Simulator and the Regression Model.
Conclusions:
- Pupil size effectively assisted in determining near-center and peripheral zone diameter values.
- Peripheral zone diameter selection is related to success
- Pupil size and radius could identify successful patients, while those not following the pupil size fitting methodology were more likely to fail.
- Correlation of the data revealed a strong association between the values generated by the SpecialEyes Multifocal Simulator and the model’s predicted near-center and peripheral zone diameter values, thus validating the simulator’s pupil-size fitting methodology.
Stay tuned for more posts on factors related to multifocal contact lens fitting success. Until next time!